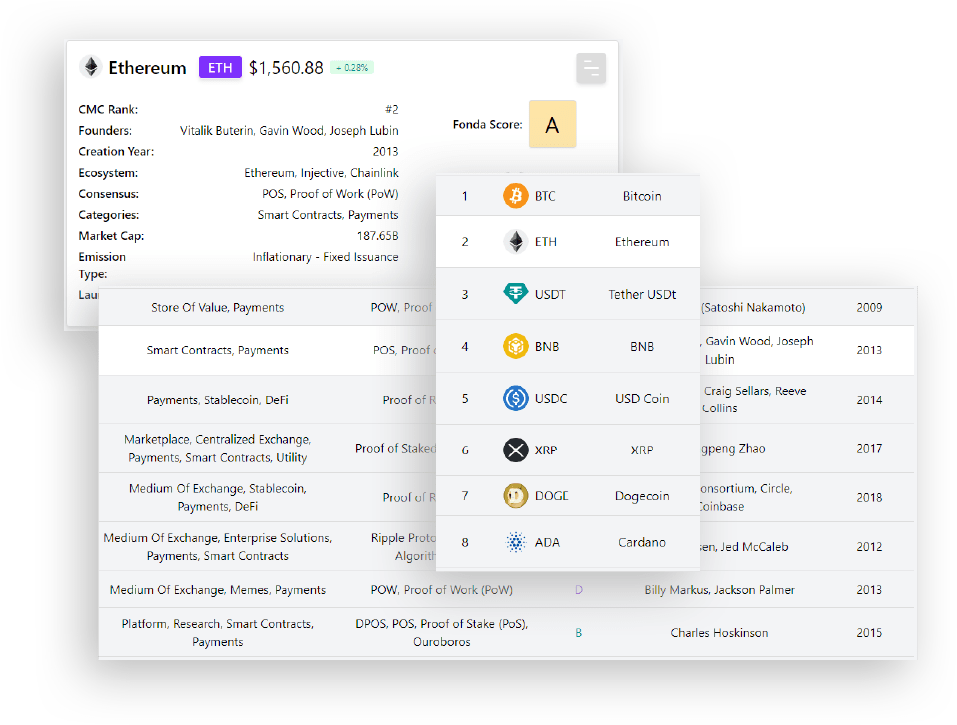
Discover real-time crypto data, cryptocurrency statistics, and market insights to transform confusion into clarity.
We’re more than a crypto data provider. Blockunity offers a streamlined app with precise crypto data visualization and in-depth cryptocurrency data analytics. Here, clarity meets accuracy, ensuring you’re always one step ahead in your crypto journey.
One step from Data-Driven Success
Aggregation, Correlation, and Democratization at your fingertips.
Born from the challenges of navigating crypto investments, Blockunity was brought to life by a passionate experienced and resilient team. We provide clarity in a complex world, empowering both novices and intermediates.
Beyond Data - Expanding your crypto toolkit
While data remains our forte, explore a suite of tools designed to further elevate your crypto endeavors.
Strategy Builder
Unlock advanced trading strategies with our Strategy Builder.
For me, Blockunity represents THE professional project, with a team that listens, reacts and is always available! I needed tools to optimize my crypto investments, and Blockunity delivers. Whether it’s for portfolio monitoring, on-chain analysis or Unyx Data indicators, everything is top notch!
CFreeman1978
Blockunity isn’t just a project. It’s a powerful tool which, when used intelligently, saves me countless hours of research, analysis and follow-up. Blockunity is also a responsive team that listens to its community.
Julien S
Impressed by Blockunity! Their analysis tools and Unyx Data really helped me understand the crypto market. The team is very responsive and reliable, which gave me confidence to invest. Thanks to them I’ve transformed my approach to crypto investing. I recommend their services!
Mitche666
Blockunity is the ideal all-in-one platform for crypto investors, there’s an advanced and fully customizable market screener. The Unyx Data are invaluable for detecting buy and sell points among other things. The advanced portfolio tracker is also very useful for keeping track of our investments. The strategy builder is very well done, and will eventually enable us to automate our position-taking and optimize returns 24 hours a day. Everything is developed by a very responsive team that listens to the community.
Foxydemon
Blockunity offers an essential set of tools as an active cryptocurrency investor. The fundamental evaluation system and Unyx Data simplify my technical analysis. The Strategy Builder allows me to optimize my strategies without programming. More than just a tool, Blockunity is a committed community that provides quality content for our education. The team shows an undeniable passion for their customers’ success, and I strongly encourage them to continue their excellent work.
We use cookies on our website to give you the most relevant experience by remembering your preferences and repeat visits. By clicking “Accept”, you consent to the use of all the cookies.
This website uses cookies to improve your experience while you navigate through the website. Out of these, the cookies that are categorized as necessary are stored on your browser as they are essential for the working of basic functionalities of the website. We also use third-party cookies that help us analyze and understand how you use this website. These cookies will be stored in your browser only with your consent. You also have the option to opt-out of these cookies. But opting out of some of these cookies may affect your browsing experience.
Necessary cookies are absolutely essential for the website to function properly. These cookies ensure basic functionalities and security features of the website, anonymously.
Cookie
Duration
Description
cookielawinfo-checbox-analytics
11 months
This cookie is set by GDPR Cookie Consent plugin. The cookie is used to store the user consent for the cookies in the category "Analytics".
cookielawinfo-checbox-functional
11 months
The cookie is set by GDPR cookie consent to record the user consent for the cookies in the category "Functional".
cookielawinfo-checbox-others
11 months
This cookie is set by GDPR Cookie Consent plugin. The cookie is used to store the user consent for the cookies in the category "Other.
cookielawinfo-checkbox-necessary
11 months
This cookie is set by GDPR Cookie Consent plugin. The cookies is used to store the user consent for the cookies in the category "Necessary".
cookielawinfo-checkbox-performance
11 months
This cookie is set by GDPR Cookie Consent plugin. The cookie is used to store the user consent for the cookies in the category "Performance".
viewed_cookie_policy
11 months
The cookie is set by the GDPR Cookie Consent plugin and is used to store whether or not user has consented to the use of cookies. It does not store any personal data.
Functional cookies help to perform certain functionalities like sharing the content of the website on social media platforms, collect feedbacks, and other third-party features.
Performance cookies are used to understand and analyze the key performance indexes of the website which helps in delivering a better user experience for the visitors.
Analytical cookies are used to understand how visitors interact with the website. These cookies help provide information on metrics the number of visitors, bounce rate, traffic source, etc.
Advertisement cookies are used to provide visitors with relevant ads and marketing campaigns. These cookies track visitors across websites and collect information to provide customized ads.